October 06, 2023
Quantifying the Impact of Poor Air Quality on Honeybees and Vegetation's Influence as a Mitigator
In Research 18 min. read
Hypothesis
We hypothesized that poor air quality would be a driver of honeybee colony mortality rates, that high vegetation density would mitigate the impact of poor air quality on survivability, and that higher wind speed will decrease the impact of poor air quality on survivability. We expected the simulation for 2023 to show an increase in projected mortality.
Method(s)
We used a data sample of 30,000 hives across 5,000 sites collected with Nectar platform's anonymized data during the 2020 to the 2023 seasons. We then combined descriptive statistics with machine learning and extracted air quality data and weather data from the hives' locations and timestamps. We then computed the different statistics for each variable (i.e. max, average, skewness and growth).
The result(s)
We established that higher air quality index is strongly correlated to increased mortality (p-value<0.005), but that higher growth in NDVI during the season is strongly correlated to reduced mortality (p-value<0.005). Indeed, the impact of bad air quality is affected by NDVI and environmental conditions where the wind speed shows to be the more impactful feature (p-value<0.005). Wind speed on its own increased the probability of mortality (p-value <0.005), but its interaction with air quality reduced the probability of mortality (p-value < 0.005). The projected impact of mortality strictly due to higher air quality index (i.e. worst air quality) in 2023 of 8% according to our model! Increasing the vegetation cover could help mitigate the impact of increased bad air quality days. - Increasing events of bad air quality combined with pesticide application and lack of vegetation could increase the negative impact on the honeybees. Finally, the honeybee could be a good bioindicator of the quality of habitat for pollinators.
Co-written by Nico Coallier, Principal Data Scientist at Nectar, and Aaron Toma, Customer Success Specialist at Nectar, in collaboration with Dr. Liliana Perez and Julien Vadnais, from LEDGE
Introduction
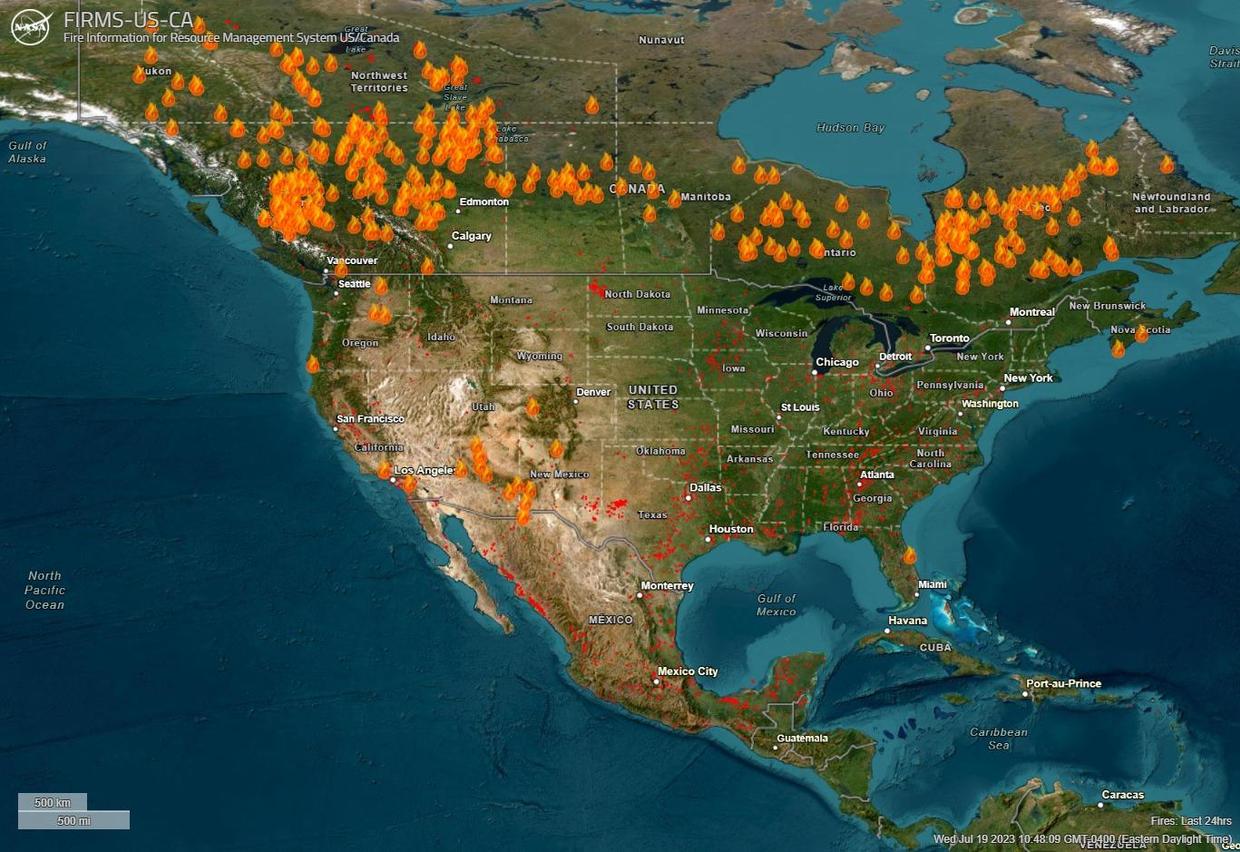
In the summer of 2023, the North American hemisphere observed multiple days of extremely poor air quality in urban areas, which were mostly due to intense forest fires in Northern Canada (see here). Both the intensity and the frequency of fires is projected to significantly increase in the future (Wang et al. 2022; Chan et al. 2022; Gaudreau et al. 2016). In addition to many economical and ecological impacts, the changes in length and frequency of fire severity could result in doubling of the wildfire-induced PM2.5 concentrations by 2050 (Sarangi et al. 2023)!
Bad air quality is known to increase the risk of many health issues for humans. The mortality associated with bad air quality was estimated to 4 million people in 2019, where 21% of this mortality was due to a chronic obstructive pulmonary disease (see UNEP report). On the other hand, the impact on our ecosystems is still not well understood (Sanderfoot et al. 2021). Insects could be heavily affected since a lot of species rely on pheromone detection and polarization of the sky for orientation, communication and foraging. Researchers have shown the effect of poor air quality on the success of mating and foraging of diverse species such as many species of Drosophilid (Jiang et al. 2023), House flies (Wang et al. 2023), Painted Lady Butterfly (Liu et al. 2021), Honey Bees (Visscher et al. 1995; Démares et al. 2022; Leonard et al. 2007) and the Giant Asian honey bees (Thimmegowda et al. 2020). Multiple studies have also shown effects on different species of birds, reptiles and mammals (Sanderfoot et al. 2021).
Like many insects, honey bees are known to rely on pheromone and flower odors (i.e. Volatile organic compounds) to mate, communicate and forage (Neurobiology of chemical communication). Multiple studies have shown the effect of increased heavy metals, ozone and fine particles on the survival, health, behavior and performance of honeybees (Cunningham et al. 2022; Negri et al. 2015; Demares et al. 2022; Leonard et al. 2007; Monchanin et al. 2022; Lusebrink et al. 2015; Reitmayer et al. 2019). The impact of different pollutants can also act on the bee’s memory of nectar sources leading to not only disorientation but also inability to remember previously identified nectar sources. Such an impact could explain a 71% increase in foraging time observed during bad air quality episodes (Cho et al. 2021), which influence pollinators' foraging behavior by decreasing their foraging efficiency.
With an increasing interest in urban beekeeping, which are usually habitats of poorer air quality, and larger and more frequent episodes of bad air quality in rural environments, understanding the impact of air quality on the health of honeybees is necessary to develop management practices, which will help beekeepers mitigate the impact of poor air quality episodes on their hive's health. As an example, the impact of the vegetation diversity and density on the resilience of bees towards higher contaminants level is something not understood and that could potentially reduce the negative impact of bad air quality, in both urban and rural settings. These learnings should also promote the role of the honeybee as a reliable bioindicator.
Indeed, over the last 35 years, honeybees have been extensively used as bioindicators (Bromenshenk et al. 1985; Goretti et al. 2020). Bioindicators are living organisms used to access the health of the natural ecosystem. They are used for assessing environmental health and biogeographic changes taking place in the environment and could help us better understand the global effect of bad air quality on pollinators in different habitats (Parmar et al. 2016). The level of contamination of the bees and other components of the hive are well correlated with the actual habitat contaminant levels (di Fiore et al. 2022; Cunningham et al. 2022; Young et al. 2023). While the honey doesn’t seem to carry over the contaminants (Borsuk et al. 2021), the impact on the health of the colonies could be used as a great indicator of the habitat quality. Similar reactions to air contaminants have been observed in diverse pollinator species such as the common eastern bumble bee (Sivakoff et al. 2020; Scott et al. 2021) and the fig wasp (Vanderplanck et al. 2021), highlighting the potential of honeybees as good indicators for pollinator communities. Considering that one out of 6 species of the 20 000 species of bees worldwide is reported to be locally extinct (see PBS article), good monitoring of their health is key to their conservation!
Air quality is generally described using the following sensor data: Carbon monoxide (CO), Nitrogen monoxide (NO), Nitrogen dioxide (NO2), Ozone (O3), Sulphur dioxide (SO2), Ammonia (NH3), and particulates (PM2.5 and PM10). The Air Quality Health Index (AQHI) can be used to assess the health impacts of varying air quality. It regroups a few of the previously cited air pollutants concentration data into a numerical index that can be used to lead various analyses. You can find a more detailed explanation of how air quality is monitored here. We will put a particular focus on the particulates since wildfires are projected to dramatically increase their contribution by the end of the 21st century (Xie et al. 2021).
In this study, we will assess the impact of the different components of air quality on the colony's survival with a focus on particulates. The increased acute exposure to different levels of contaminants in different habitats hasn’t been studied before. In addition, we will access a sample size of over 30,000 hives on over 5,000 sites tracked over two seasons across North America which will allow us to identify more generalizable findings on the effect of air quality on honeybees and what landscape structure effect could help mitigate these effects. All hives within the analysis are tracked using the Nectar platform and are subject to similar management practices.
What does the data say?
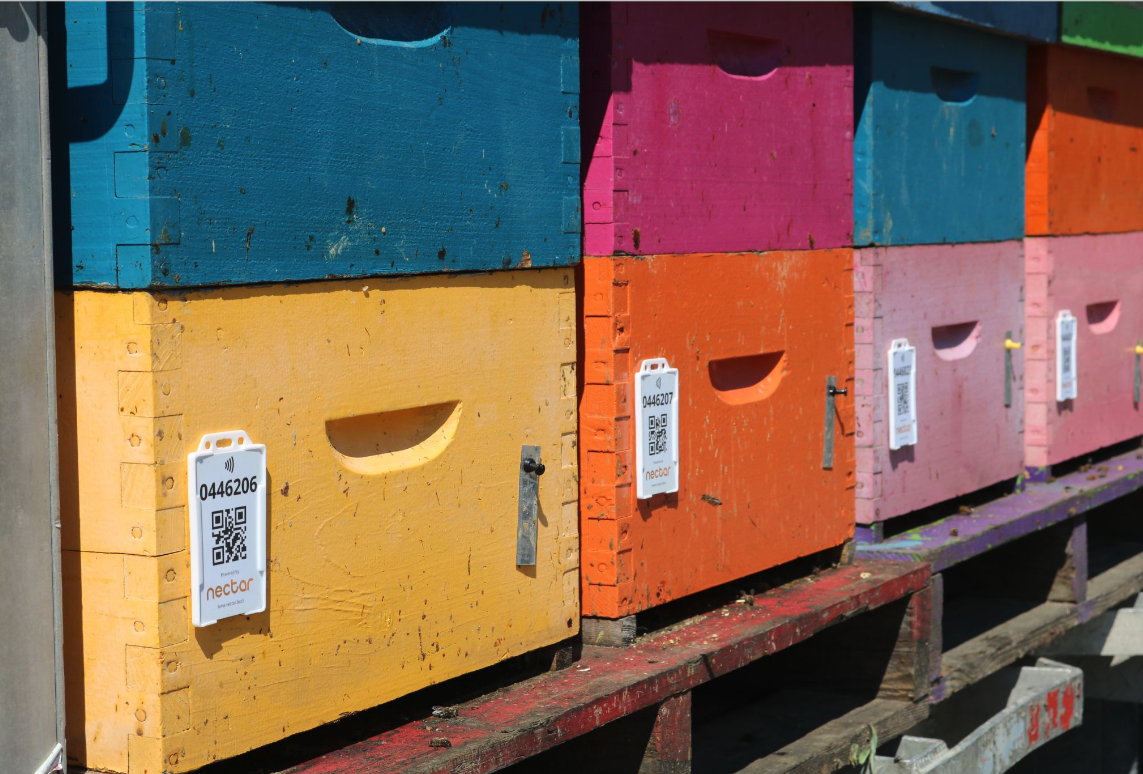
In this study, we use anonymized data from beekeepers using Nectar 1.19, an apiary tracking and management platform particularly suited to commercial beekeepers. Our platform enables beekeepers to record a history of all actions, states, location, movements and so on across their livestock. In this way, analyses can be carried out to better understand potential optimizations or opportunities. In addition, the beekeepers enter a feedback loop, as they can evaluate the impact of their decisions.
We therefore have access to historical data from the 2020-2021 and the 2021-2022 seasons on operations scattered across North America. The operations selected for this study are based in the following states and provinces: Quebec, Alberta, Nova Scotia, California, and Washington. We used only those operations for which we have at least one full year of follow-up data, in order to capture mortality over one season.
Although it is possible to mitigate the wide difference in nomenclature and practices used in data collection, we will only look at the effect of hive position by considering their movements on hive survival. From publicly available data, we can access several environmental factors likely to affect the health and therefore the survival of bees. We have chosen to include in our analyses daily air quality (AQHI), daily temperature, daily precipitation, daily mean wind speed, daily dominant wind direction and an index of vegetation intensity that we can extract from satellite images (i.e. NDVI). Air pollutant data was retrieved via Airpyllution, a Python package that provides access to current and historical air quality data using the OpenWeather API. Particular attention will be paid to the effect of air quality on bee survival, and the scenarios that can increase or decrease it. Poor air quality is expected to reduce the survival chances of bees that are chronically exposed to it.
To analyze the data, we used two fundamentally different approaches: a statistical analysis using linear mixed models to mitigate the impact of repeated and correlated measurements, while allowing us to identify significant correlations in our dataset. The use of such a model may vary, but since the aim of this first analysis is to describe the dataset and not to make a prediction of the effect of a future increase in fire. We decided to train a model that combines machine learning with the field of survival analysis, i.e. RandomSurvivalForest. By validating the predictive potential on a portion of the dataset not used when training the model, we can estimate the desired effect with greater confidence. Note that these models predict mortality and that we will refer to mortality and not survival during this section.
Building the AQHI index
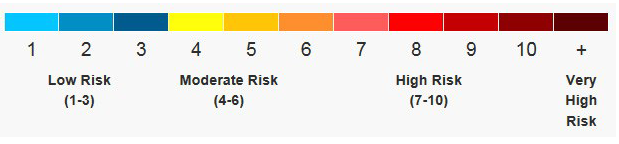
The AQHI index is a combination of fine inhalable particles, with diameters that are generally 2.5 micrometers such as (PM25), Nitrogen dioxide (i.e. NO2) and Ozone (i.e. O3). The components are combined using the formula developed in the following paper. The index is usually used to assess risk for human health with the following chart.
Note that we did compare the index with the usage of each independent component and also tested a dimension reduction approach but all models without the AQHI were ignored due to lower performance.
Descriptive statistics
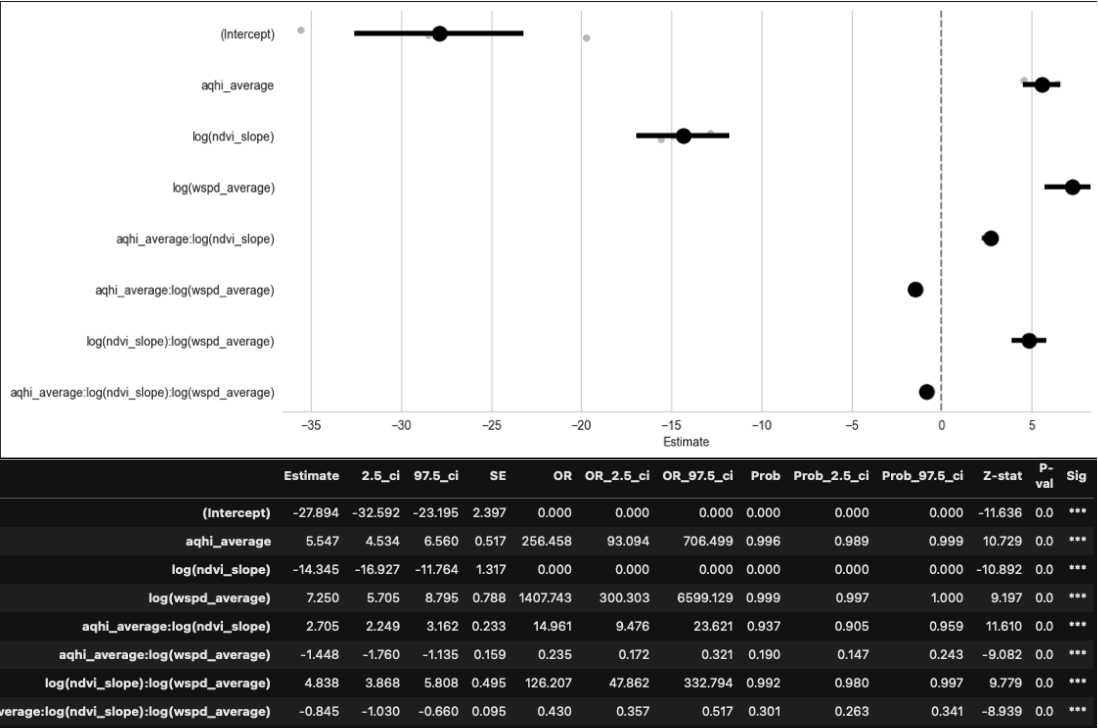
Out of 22 trained alternative models, we selected the most parsimonious model using the Akaike Information Criterion (i.e. AIC). Below, we can see the results of the model, showing their effect on survival probability. The model includes air quality, mean wind speed, summer growth in the plant presence index and their interactions.
Although several effects are significant, let's focus on the most important ones. There was a clear positive effect of poor air quality on mortality (5.547, p-value<0.005) and of wind speed (7.25, p-value<0.005) which also increased the probability of mortality. On the other hand, summer growth in the vegetation index (-14.35, p-value<0.005) decreased the probability of mortality.
As the vegetation index is affected by poor air quality, some of the results below potentially reflect intense smog events such as the intense fires in California in the year 2022. Clouds will bias the NDVI towards negative values. Therefore, the growth in NDVI value over the summer will be affected by these low NDVI values biased by the clouds in early summer and will lead to stronger growth coefficients which are not due to increased vegetation but just to less clouds on the images. It can also show the importance of the moment in which these poor air quality happens since lower values in late summer would bring that slope coefficient towards zero, it seems that forest fires occurring early in the season are therefore more impactful on mortality
Machine learning and simulations
As mentioned, we trained a predictive model using 85% of the dataset and validated its performance on the remaining 15%. This model uses several statistics on all variables (i.e. mean, max, skewness, growth). The model's performance was evaluated using the concordance index. This index assesses whether the model predicts higher survival values for all correctly predicted hives. The model obtained a value of 85% on this score, meaning that 85% of the pairs compared agree between the survival event and the associated probability. We also assessed the model's accuracy, which is a value of 82% (mean survival of the test set 36%).
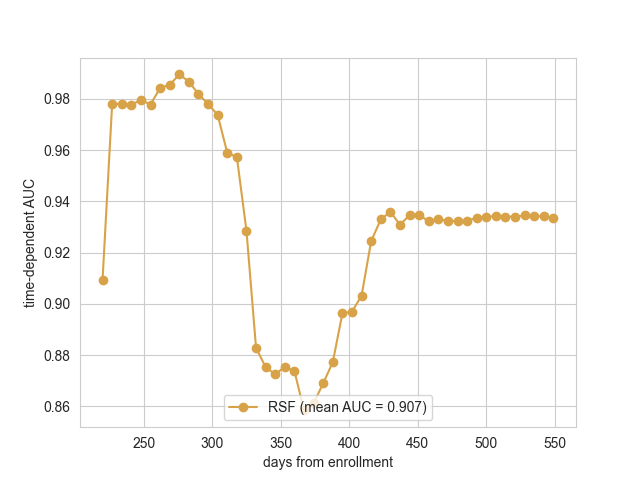
Below is the AUC (Area under the ROC curve) which is a metric often used when target variable (mortality) is unbalanced. In survival analysis, we often report that metric in relation with the age of the subject in the study and their age. We observe a mean AUC of 0.907 where a slight decrease in performance is observed between 300 and 400 days which often concord with the first winter. In one sentence, AUC represents the probability that a random death hives is positioned to the right of a random survived hives.
What can we expect in the future?
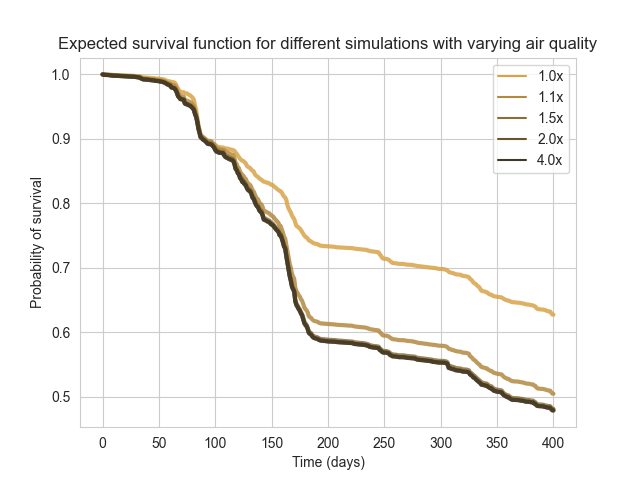
Using this model, we simulated scenarios of increasing poor air quality, respecting the location of the hives and its environmental factors. As levels in 2023 are already 10% higher than those observed in 2022, we simulated the expected impact on mortality, assuming stability in the other factors in order to simplify interpretation. While the average observed mortality is 32%, the model predicts an average mortality of 31%, assuming stable air quality. A 10% increase in air quality index values is predicted to cause an average mortality increase of 8% (see figure 2).
More vegetation seems to help!
As stressors add up and as smoke limits the foraging capacities of bees, we guessed that the effects of poor air quality on honeybees could be exacerbated in low vegetation areas. In contrast, a healthy colony that has access to plenty of flower resources can surpass lower air qualities and find a way to survivability.
To assess the vegetation hypothesis, we have collected satellite data for all apiaries. Three remote sensing indices of vegetation have been chosen to portray the vegetation landscape: NDVI, LAI, and fPAR. Indices such as NDVI, LAI and fPAR allow us to study the relationships between ground-based measurements of species richness and satellite measurements of vegetation productivity and function (Duro et al., 2007; Perez et al., 2016). Therefore, it is assumed that these indices serve as direct indicators of the quality of bee habitat. Since these indexes were highly correlated and NDVI showed the strongest predictive power, we choose to only look at NDVI in this post.
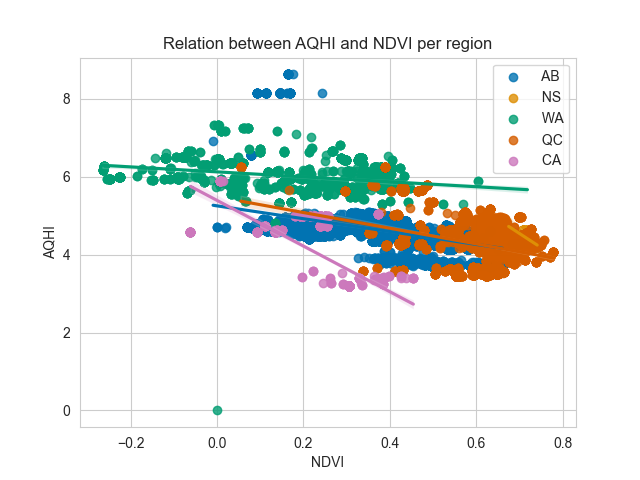
The statistical model (-14.35; p-value < 0.005) as well as the predictive model (5th most important feature) showed us the positive impact of NDVI on the survival of honeybees. As hypothesized, the NDVI seems to help mitigate the effect of AQHI. We need to dig deeper in that question and we will in the scientific paper we are currently working on with the LEDGE team. For the time being, the figure below shows the relation between NDVI and AQHI per region and we can clearly see that NDVI seems to help reduce the AQHI and that the relationship isn’t the same by region. The slope for California, which is highly affected by forest fires, is much steeper than the curve for Washington state for example. That could mean that the impact of vegetation is more impactful on the air quality for that region and also reflect the bias of smog on NDVI as mentioned earlier.
What’s coming to Nectar and what are the next steps?
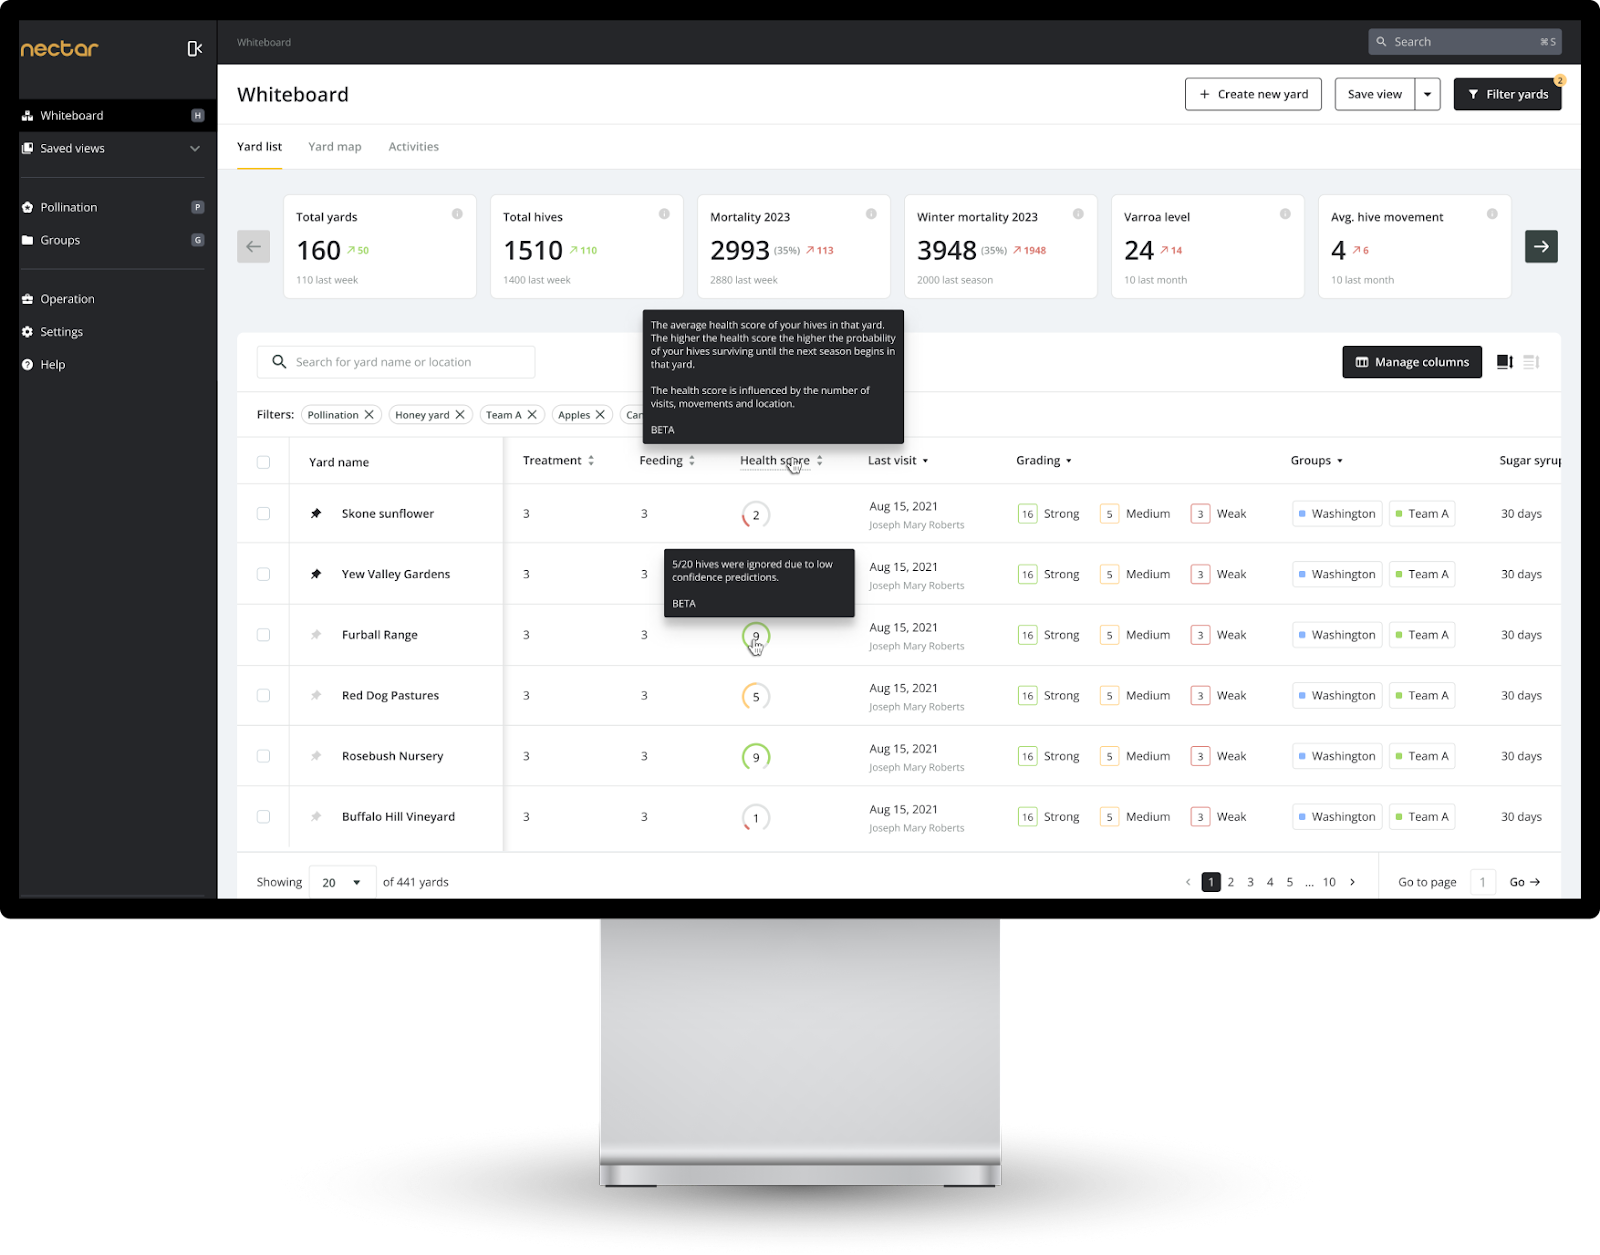
Coming soon in Nectar will be our first AI powered feature, the health score. The deep learning model that will be used in the Manager Portal to generate the health score considers the sequence of change in air quality as well as other environmental features. The health score is a proxy of the expected health of the hives in the future.
Therefore, the model will assess the impact of bad air quality and help beekeepers make decisions to mitigate the impact of these increasing episodes of bad air quality. The beekeepers will be able to assess the quality of their habitat by using the predicted survival that is displayed at hive, yard and operation level. Doing so, beekeepers will enter a continuous feedback loop where they can challenge their practice such as the location of their hives and the decision to move bees or not. We will talk more about the deep learning model used for the health score in a future blog post but it uses the same data used in this blog post with more advanced techniques.
Conclusions
As hypothesized, air quality is a strong driver of honey bee survival. We’ve shown that the increase in frequency and intensity of forest fires seems to already affect the quality of habitat for honeybees and pollinators in general. While we can’t take direct actions to reduce the forest fires and while the other sources of air contaminants are hard to quickly reduce, we need to find factors and management practices that can reduce that negative impact.
We’ve successfully shown the positive effect of vegetation on the health of bees particularly in habitat were forest fires play a major role on the air quality (i.e. California and Alberta). Managing the land in a way where we increase the vegetation in regions of frequent forest fires or in the regions affected by these fires (ex: North east of the US this summer highly affected by forest fires in the North of Quebec) could also help mitigate the impact of bad air quality. We recommend placing hives closer to dense vegetation areas during the heavy forest fire season so the effects are reduced, the hives could then be moved once the air quality stabilizes.
As shown in the literature, honeybees become less efficient foragers in the context of high smog, honeybees spend 71% more time in the flowers to collect less nectar (Cho et al. 2021). This effect combined with the presence of pesticides could be dramatic since it increased their exposure to pesticides and could lead to even more detrimental effects! Adopting practices where pesticide applicators are aware of the air quality when planning to spray could really help mitigate the potential side effects of the increasing frequency of bad air quality days. Identifying a threshold where the probability of survival is below 50% could help make better decisions when applying pesticides. From our data, it seems that a value of AQHI above 6.5 leads to an average probability of survival below 50%. Our recommendation is to avoid spraying when AQHI is above that value or in the days following that value since the foraging ability is slowed for a couple days following the bad air quality event (Cho et al. 2021).
Finally, as mentioned earlier, these results could indicate that honey bees are a viable bioindicator of the quality of the habitat for other pollinators. The hives talk to us, and tracking survival could be used as an indicator of the quality of the habitat as we showed but evidently tracking more data such as varroa levels, honey production, queen genetics or/and strength of the hives, will tell us more!
Improving the model and increasing our sampling size could help us better understand these effects globally and provide insights to better manage our land and pesticide usage to reduce the impact on the communities of pollinators!
Stay in touch, we are working on more advanced modeling and scientific publications on this topic in addition to the data collection that grows everyday in Nectar!
About Nectar
Nectar is a precision beekeeping company based in Montreal, Canada and offers BeeTrack, a traceability and management platform for commercial beekeepers.
Interested in learning more about Nectar and our solutions? Click Here.
About LEDGE
Located in the Department of Geography at the University of Montreal and directed by Dr Liliana Perez, the Laboratory of Environmental Geosimulation (LEDGE) hosts a research group interested in the study of the dynamics of complex geographic systems.
References
About the author
Nico Coallier
CTO at Nectar Technologies, Co-Funder and lead beekeepers at Flavo and Lead of research and co-funder at Cubee.
Recommended articles
By Sam Venis January 27, 2026
One Year Later: How Cubee Helped Beekeepers Boost Hive Survival
In 2024, 1,400 doses of Cubee were sent to eight Nectar users to test whether regular supplementation could help colonies live longer. The results are in.
In Product 3 min. read
By Sam Venis December 15, 2025
Four Practical Ways to Operate More Efficiently This Pollination Season
The best commercial beekeepers don’t just manage the chaos—they plan ahead, streamline movement, and use their data to avoid unnecessary labour and costs.
In Product 5 min. read
By Nico Coallier September 25, 2025
Nectar’s Mite Management Protocol
Varroa mite monitoring is a critical part of effective digital beekeeping. This guide outlines a standardized protocol every beekeeper can follow to collect better data, make smarter treatment decisions, and protect more colonies.
In Research 5 min. read